Combined Heat and Power Focus
BEIS's Free resource supporting the development of CHP
CHP Helpline 01235 75 3033
The UK CHP Development Map is designed to geographically represent the heat demand across various sectors with the United Kingdom. Use this section to find out more about using the UK CHP Development Map by exploring the sections below.
You can jump to a specific section by using the following links:
Features
A summary of the features of this map are shown below.
- Multiple layers overlays
- Point load data overlay
- Multiple sector options
- Postcode Zoom
- Download search results in a format for use in MS Excel
- Polygon View
- Polygon search
- User defined polygon search
- Radius Search
Click on the topics below to find out more about using the CHP Development Map.
The Map
Generic Controls
These tools can be found on the top right hand side of map viewing window below the background controls. They have a number of useful functions outlined below:
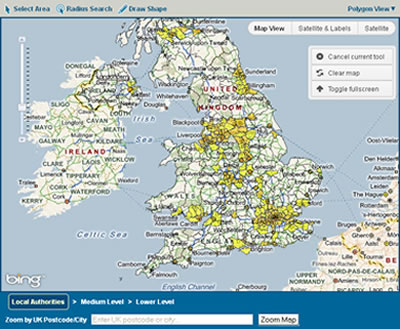
Cancel Current Tool – Clicking on this tool cancels the most current tool that has been used on the map.
Clear Map – Clicking on this tool removes any drawings, outlines or radii selections you have made, returning the map to its initial state.
Toggle Fullscreen – Clicking on this tool shows a full screen version of the map viewing window.
Zoom
In the grid view the grid always shows a 1 x 1 km square area.
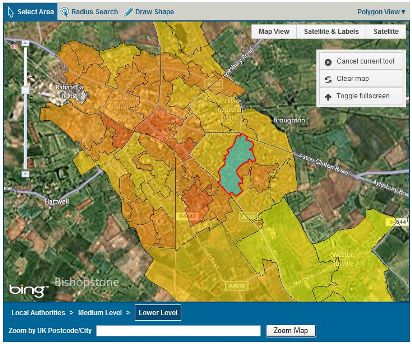
In the polygon view there are three Zoom levels available, these levels show when the area polygons shown represent:
Local Authorities level – Local Authority boundaries
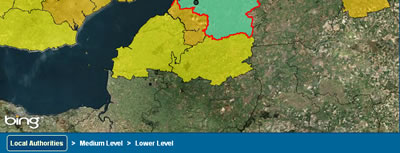
Medium Level – Middle Layer Super Output Area

Lower Level – Lower Layer Super Output Area

Zoom Control
In addition to the standard zoom slider bar, you can also zoom to a specific location using the search function which allows you to enter any UK postcode or placename.
This uses Bing Maps to correctly identify the place you have entered, so it will help to be as specific as possible.

Viewing Options
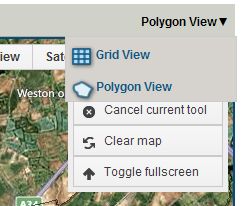
Grid View – The grid view shows the UK divided into a 1 x 1 km grid. This view shows detailed information to a resolution that is greater than is available in polygon mode, however this mode does not give regard to Super Output Areas which are linked to population.
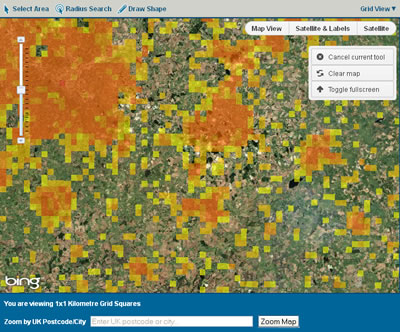
In grid view a message is shown below the map view stating the constant resolution of 1 x 1 km squares.
Polygon View – The polygon view shows the UK divided into local authority area, Middle Layer Super Output Area or Lower Layer Super Output Area. This view enables you to carry out map queries based on these population based polygons.
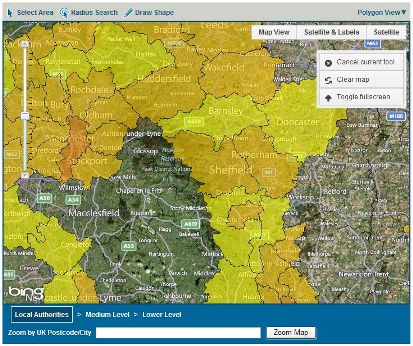
In polygon view a polygon resolution breadcrumb trail is shown below the map view showing which zoom level is currently being displayed.
To change the view click on the view hyperlink in the top right hand corner above the map view, a list of grid view or polygon view will dropdown. Select the view you wish to work in.
Search Options
There are several search options you can use determine heat loads depending on whether you are interested in heat demand in the area surrounding a defined point or the heat demand within a defined area, either drawn by you or from the boundaries provided in the grid or polygon view. These options can be found above the left hand map viewing window.
The search options are:

Select Area Tool:
Grid View – This option allows you to choose a 1 x 1 Km square area and query the database for heat demand results within that square.
Polygon View – This option allows you to choose an outlined polygon and query the database for heat demand results within that square. These polygons can vary in area and they may be local authority, Middle Layer Super Output Area or Lower Layer Super Output Area depending on the zoom level.
Operating Select Area Search
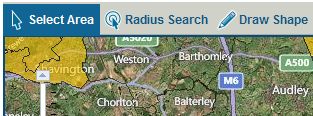
Enabling / Disabling Select Area search mode – Click on the "Select Area" hyperlink to enable the select area search mode. Click on the "Select Area" hyperlink again to disable the select search area tool.
Carrying out Select area search – move mouse pointer over area of interest and click the right mouse button. The query results are displayed in a table in the results section to the right of the map viewing window. Note: the map is operating in fullscreen viewing mode the results table will not be visible till you return to the normal map view.
Operating Radius Search
Enabling / Disabling Radius Search mode – Click on the "radius search" hyperlink to enable the radius search mode. Click on the "radius search" hyperlink again to disable the radius search tool.
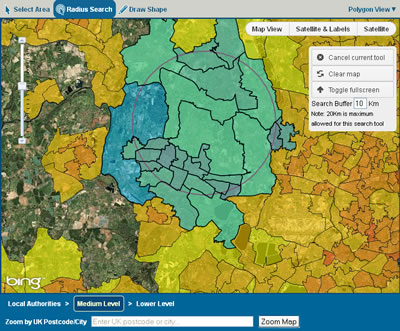
Carrying out radius search – move mouse pointer over area of interest and click the right mouse button. The query results are displayed in a table in the results section to the right of the map viewing window. The default search radius of 10 km this search can be adjusted by changing the search buffer which appears in the generic tools area on the top right hand side of the map viewing window. Note: the map is operating in fullscreen viewing mode the results table will not be visible till you return to the normal map view.
Operating Draw Area
Enabling / Disabling Draw Area Search mode – Click on the "draw area" hyperlink to enable the draw area search mode. Click on the "draw area" hyperlink again to disable the draw area search tool.
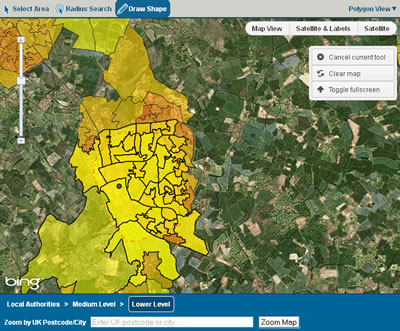
Carrying out draw area search – move the mouse pointer to a starting point over the area of interest and hold down the right mouse button while using the mouse to draw a shape (highlighted in red) around the area of interest, once you have drawn around the area desired release the right mouse button, the map will complete the shape and return the query results are displayed in a table in the results section to the right of the map viewing window. Note: the map is operating in fullscreen viewing mode the results table will not be visible till you return to the normal map view.
Legend & Layers
Map Values – this is the legend which explains the heat density each colour in the map represents.
Choose Sector – this section gives you the ability to choose the sector of interest from the list of options, the map view window will adjust to reflect the densities for heat demand within the chosen sector.
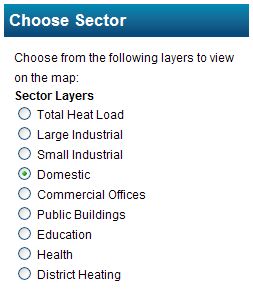
Change Sector – The map defaults to "total heat load" which displays the total heat density within the given areas. To change the sector click on the radio button next to the sector title of interest.
Additional Layers – this section gives you the ability to choose an additional layer showing points of interest from the list of options, for example Large Heat Loads shows point heat demands greater than 5 MWth which may be interest as anchor loads for heat network development. Once you have chose the additional layer the map view window will then superimpose the chosen layer on the map view.
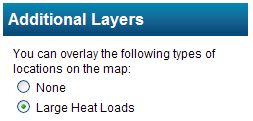
Change additional layer – The map defaults to "none" with the additional layers disabled. To choose an additional layer click on the radio button next to the additional layer of interest.
Results
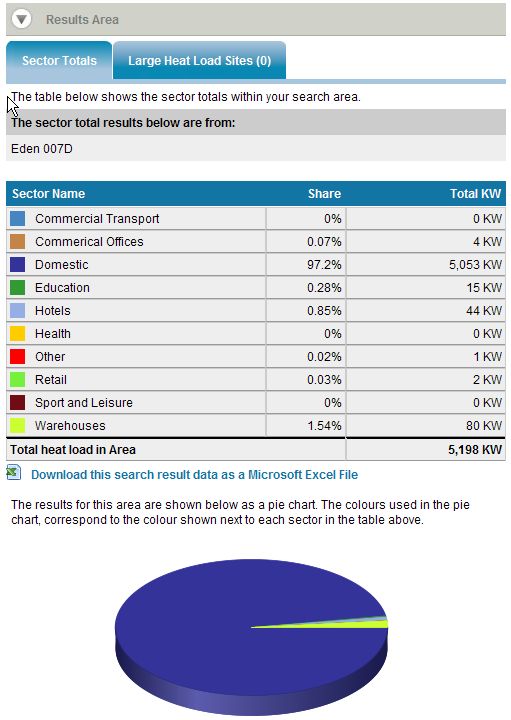
The results area provides the results of any queries carried out by the map. In this section there is a tabbed view,
The Sector Totals tab provides:
- A summary of the areas queried
- A table of Sector Totals (with total heat load provided)
- A link to download the query results in an MS Excel compatible format
- And a Pie Chart of the Sectors provided in the table
The Large Heat Load Sites tab provides:
- A table specifying the operator and heat demand associated with the site (with total heat load provided)
- A link to download the query results in an MS Excel compatible format
Further Help
If you need further assistance please call the CHP Focus helpline 01235 75 3033.